
Beth Umlund
Authored by Beth Umland; Director of Research, Mercer
Most organizations that invest time and money in an initiative want to be able to evaluate how well the initiative is meeting objectives – and how the results they achieve compare with similar efforts by other organizations. This has proven difficult in the field of employee health and well-being programs, partly because outcomes in these areas are hard to measure, but also because no standard set of metrics has been agreed upon.
The HERO Health and Well-being Best Practices Scorecard in Collaboration with Mercer (HERO Scorecard) includes an optional section on program outcomes that introduces a set of core metrics developed as part of a joint project undertaken by HERO and the Population Health Alliance. The full report, Program Measurement & Evaluation Guide: Core Metrics for Employee Health Management may be accessed through the HERO website. Our objectives for including a core set of metrics in the HERO Scorecard were:
- to provide an inventory of best-practice metrics for evaluating program success, just as the HERO Scorecard serves as an inventory of well-being program best practices;
- to direct employers and industry professionals to the Measurement and Evaluation Guide; and
- to build a database of outcomes data for research purposes.
While completing the outcomes section of the HERO Scorecard is optional, more than 300 employers have provided at least some of the outcomes data requested to date. This commentary summarizes some of the findings for which we had adequate numbers of responses. For now, these results can be used for benchmarking purposes; as we collect more data we will be able to examine the relationships between outcomes and specific best practices, to learn more about which practices have the biggest impact.
Metrics included in the HERO Scorecard address:
- Participation rates
- Employee assessments
- Health measures
- Lifestyle behaviors
- Financial impact
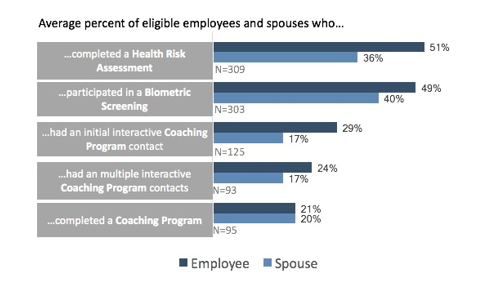
Participation rates
On average, 51% of respondents’ employees (and 36% of eligible spouses) completed a health assessment. Biometric screening rates were similar, at 49% of employees and 40% of eligible spouses. Participation rates are somewhat lower for coaching programs: 29% of eligible employees had an initial interactive contact with a coach, 24% had multiple interactive contacts, and 21% completed a coaching program.
Employee assessments
More than 100 respondents were able to provide results from employee assessments (typically collected through a survey). The HERO Scorecard asked respondents to provide results to two questions that might be part of an employee assessment. The first was simply the degree of satisfaction with the company’s health and well-being programs. Respondents report that, on average, just under three-fourths of their employees (72%) are satisfied with the company’s programs. The second question is one that can be used to gauge success in creating a culture of health: asking employees whether they agree with the statement “My employer supports my health and well-being.” Although somewhat fewer HERO Scorecard respondents provided results from this assessment than for the question on satisfaction with the program (130 compared to 119), the average percentage of employees who agreed was the same: 72%. This finding suggests that satisfaction with the health and well-being program tracks very closely with perceived organizational support.
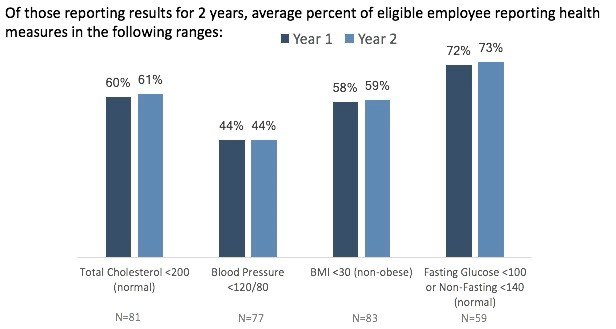
Health measures and lifestyle behaviors
HERO Scorecard respondents are asked to provide results for a range of health measures for two years for which they have data. (Note: “Year 1” is not necessarily the first year of the program, nor are the two years necessarily consecutive.) On average, respondents found a slight improvement or no change in the percentage of employees in the normal range for each of these measures, which include total cholesterol (on average, 61% of employees were in the normal range in year 2, compared to 60% in year 1), blood pressure (44% in the normal range in year 2, unchanged from year 1), BMI (59% non-obese in year 2, up from 58% in year 1), and glucose (73% in the normal range in year 2, compared to 72% in Year 1).
For lifestyle behaviors reported on a health assessment, average results for years 1 and 2 did not differ significantly. Looking at year 2 results, respondents reported following average results: employees not using tobacco, 84%; not depressed, 80%; not at risk for stress, 66%; averaging 7-9 hours of sleep/day, 63%; obtaining moderate physical activity, 55%; and eating an average of 5+ servings per day of fruits and vegetables, 29%. No more than 85 respondents provided two years’ of results for any one measure. It is difficult to interpret this data without more information. As the database grows, it will be interesting to compare the year-over-year improvement (or lack of improvement) for respondents based on their overall best practice score, or even based on the level of perceived organizational support.
For lifestyle behaviors reported on a health assessment, average results for years 1 and 2 did not differ significantly. Looking at year 2 results, respondents reported following average results: employees not using tobacco, 84%; not depressed, 80%; not at risk for stress, 66%; averaging 7-9 hours of sleep/day, 63%; obtaining moderate physical activity, 55%; and eating an average of 5+ serving
s per day of fruits and vegetables, 29%. No more than 85 respondents provided two years’ of results for any one measure. It is difficult to interpret this data without more information. As the database grows, it will be interesting to compare the year-over-year improvement (or lack of improvement) for respondents based on their overall best practice score, or even based on the level of perceived organizational support.
Financial impact
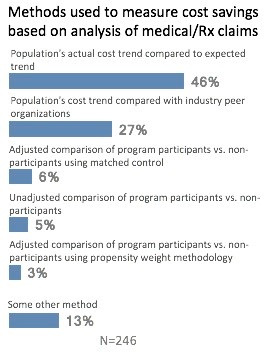 The majority of respondents reporting on the financial impact of their health and well-being programs say they review medical/pharmacy claims experience to determine savings. Most commonly, respondents using claims experience compare their population’s actual cost trend to the expected normative trend (46%); some (27%) compare their population’s cost trend with industry peer organizations, and a few (3%) perform an adjusted comparison of program participants vs. nonparticipants using matched control. Among the 25 respondents providing savings per enrolled employee per year, the median savings was $304. Among the 25 providing savings as a percent of total health plan cost, median savings was 3.1%.
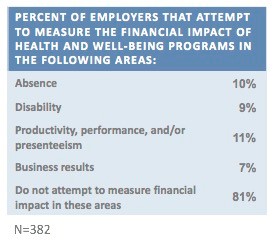
In addition, a small number of respondents measure the financial impact of their health and well-being programs on such non-medical areas as absence (10%); disability (9%): productivity/performance (11%); or business results (7%).
While any data demonstrating a positive financial impact is intriguing, it’s important to keep in mind that the average savings amounts were based on relatively few employers. As the database grows, we hope to provide more solid evidence of the potential for savings – along with an analysis showing the types of programs that achieve the best results.
Beth Umland is the Director of Research for Mercer’s health and benefits practice. She and her staff conduct Mercer’s flagship National Survey of Employer-Sponsored Health Plans. She helped establish the first online HERO Scorecard in 2008 and remains a part of the HERO-Mercer team. Mercer’s health benefits research is used widely by employers, the health care industry, the media, and health policymakers. Beth had been widely quoted in media outlets such as the New York Times, Forbes, CFO, and the Wall Street Journal. She is a graduate of Wellesley College.
This commentary is based on data from the HERO Scorecard Benchmark Database through June 30, 2017.