
Authored by Gretchen Heacock, M.Eng; Wellness Solutions Specialist, Mission Health System
Wellness incentive designs are a hotly debated topic when it comes to structuring programs designed to drive high participation and improve health outcomes. The HERO Health and Well-being Best Practices Scorecard in Collaboration with Mercer© (HERO Scorecard) assesses employer use of three types of incentive designs.
The assessed incentive designs include:
- Participation-based incentives: providing rewards for participating in one or more aspects of health and well-being programs or offerings, such as a health assessment, biometric screening or coaching;
- Outcome-based incentives (health contingent): providing rewards for achieving, maintaining or showing progress toward a health-status target; and
- Activity-based incentives (health contingent): Providing rewards for completing a specific activity related to a health factor, such as taking 10,000 steps per day
When formulating an incentive design the following come into play: the balance between participation and non-participation rates, employee satisfaction with the wellness program, employee feelings of support for health and well-being from the company, and the impact of the incentive on initiating and sustaining behavior change. As companies broaden their value proposition for wellness beyond the traditional health and health care cost outcomes, employee satisfaction and perceived support for health and well-being increasingly become measures included in assessing the value of a program. Indeed, high levels of participation and employee satisfaction are leading indicators of potential well-being initiative success, validated by the lagging measures of effectiveness, including behavior change, improved well-being and other desired outcomes.
The purpose of this analysis is to leverage questions on the HERO Scorecard to give real-world insight into the influence of incentive design on employee participation, satisfaction, and perceived employer support. It relies on data from 777 organizations that completed the HERO Scorecard to determine how incentive design (participation-based, outcome-based, activity-based, or combination of two or more of those) is associated with employee participation in programs, satisfaction with programs, and perceptions of employer support for their health and well-being. Not evaluated in this study are other factors that play into the success of the program, such as company culture, marketing strategy, amount of incentive, or leadership support. This analysis addresses the influence of type of incentive on participation, statisfaction, and perceptions based on descriptive characteristics of these variables. The impact of incentives on behavior change was excluded because of limited availability and precision of outcome data in the HERO Scorecard database.
Prevalence of Financial Incentives and Incentive Design
Of the organizations that responded to questions about their use of financial incentives for health and well-being programs (n=765), 63% used financial rewards or penalties, 16% used token gifts as rewards, and 21% offered no financial incentives.
Breaking down those that used financial rewards in their incentive design (n=484), the most common incentives were solely participation-based (36%), a combination of participation- and activity-based (25%), and a combination of all three incentive types (20%). The least common incentive designs were a combination of outcome-based and activity-based (1%), activity-based only (2%), outcome-based only (2%) and a combination of outcomes and participation-based (10%). Three percent (3%) did not answer the question about incentive type even though they provided financial incentives.
The low rate of outcome-based only (n=11) and activity-based only (n=12) approaches was notable, as were the findings that most employers were using participation-based incentives alone or in combination with other approaches and that 63% (n=306) did not use any type of outcome-based component. This observation was consistent with recent survey results from the National Business Group on Health suggesting that employers may be moving away from outcome-based incentives, as indicated by a decrease in use from 44% of employers in 2015 to 24% in 2016.1
Financial Incentives and Incentive Design Structure on Program Participation
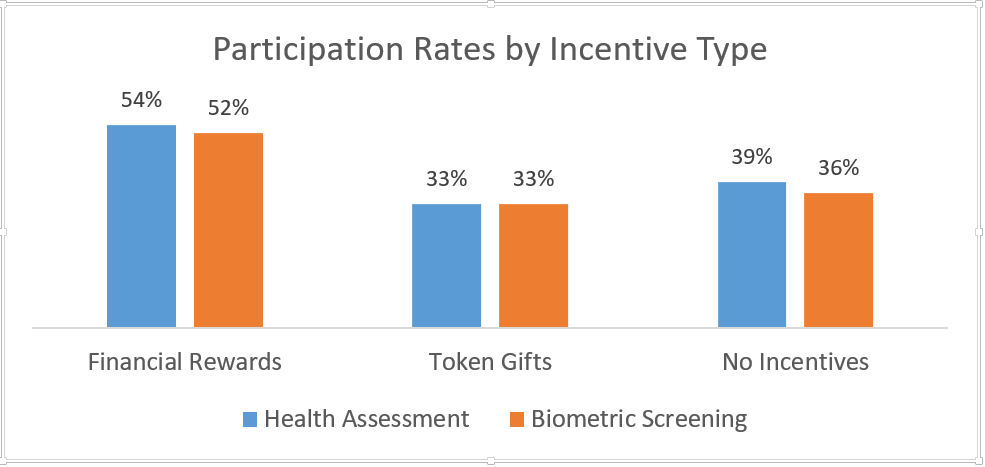
This analysis found that financial incentives were associated with higher participation rates for health assessments (54% participation) and biometric screenings (52% participation), with incentives significantly influencing reported participation rates in these two transactional activities compared to participation rates when token gifts or no financial incentive were used. However, participation rates were higher for organizations using no incentives, compared to those using token gifts for both health assessments (39% versus 33%) and biometric screening (36% versus 33%). This finding suggests that using token gifts as incentives for these activities may not be worth the cost if similar participation levels can be achieved without them based on intrinsic motivation alone, but more research must be done to understand and interpret this finding. The majority of organizations providing coaching participation data used financial incentives so comparisons cannot reliably be made against organizations not using financial incentives.
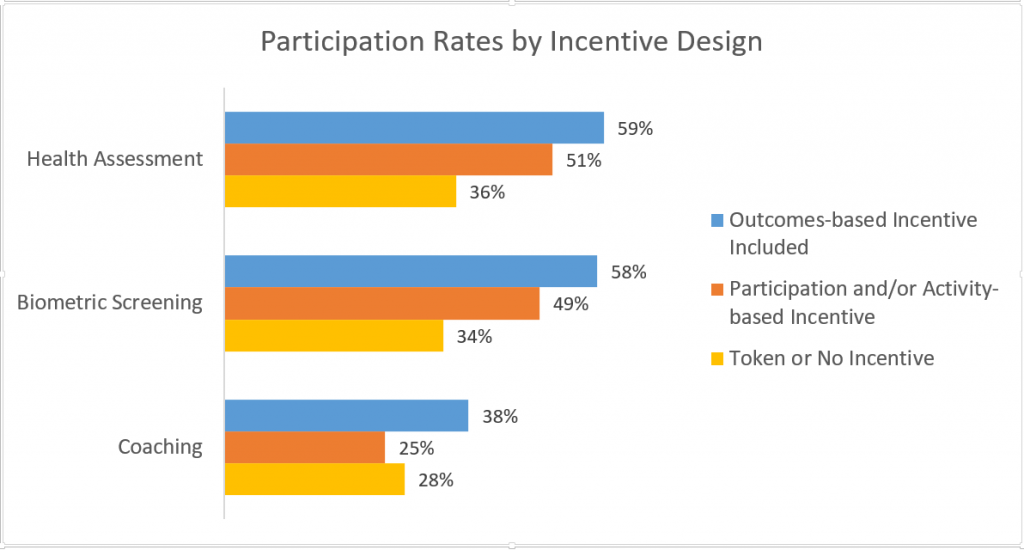
To get a better understanding of the influence of outcome-based incentives, data were combined for those that included an outcome-based component (alone or in combination with participation- and/or activity-based incentives) compared to those that used participation-based and/or activity-based incentives or no incentive. Participation rates for biometric screenings and health assessments were noticeably higher when at least a portion of incentives were based on health outcomes. Coaching participation was also higher for outcome-based incentive programs, perhaps due to participation in coaching programs serving as a reasonable alternative standard to earn an incentive if an individual did not meet biometric requirements. However, an alternative explanation for these findings is that the size of the incentive may have been higher for outcome-based incentive designs. The lack of data on incentive size provided by HERO Scorecard respondents precluded assessing the role of incentive size in this analysis.
Relationship between Incentive Design Structure and Satisfaction and Perceived Support
As seen above, financial incentives clearly influenced participation rates. When looking at satisfaction levels, use of token gifts (76% satisfaction) and financial incentives (72% satisfaction) were associated with higher levels of satisfaction compared to organizations not using incentives (66% satisfaction). This data counterbalances the finding of slightly lower participation rates when token incentives are used, indicating these small rewards may be worthwhile if larger incentives are not feasible and employee satisfaction is important to the employer. However, employee perceptions of organizational support for their health and well-being were lower when token gifts or no financial incentives were offered (69% each) as opposed to financial incentives (74%).
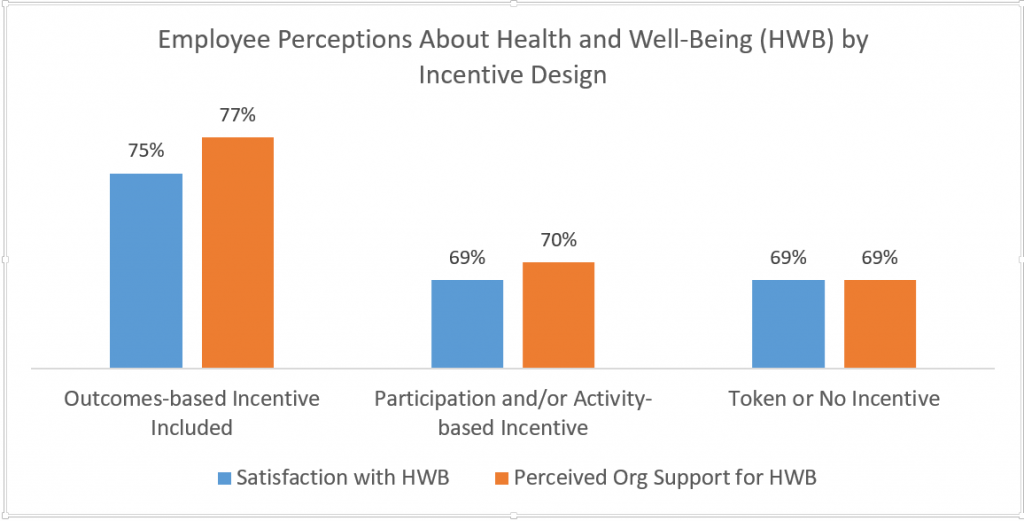
Organizations that included an outcome-based incentive component versus participation and/or activity-based incentives reported higher satisfaction (75% vs 69%) and greater perceived support (77% vs 70%). Levels of perceived support were similar for organizations that relied on the use of token or no incentives (69%). More research is needed to understand the factors driving these differences (e.g., marketing, company culture, incentive amounts, variety of programs offered, leadership support).
Conclusion
HERO Scorecard respondents reported less use of outcome-based incentives versus participation-based incentives, activity-based incentives, or no incentives. Companies appeared to rely heavily on participation-based incentive designs or using a combination of incentive approaches to try to engage employees in certain health and well-being activities. Based on the results reported in this commentary, organizations considering incorporating incentives into their initiatives may want to ask the following questions:
- What types of program participation or employee behavior am I striving to achieve?
- How might this incentive design influence the culture of my company?
- Is employee satisfaction with programming and perceived support important? How would one incentive design versus another be perceived in my company?
- If the company were to change its incentive design, would this positively or negatively impact participation or satisfaction within the context of its organizational culture and what is most important to its employees?
- Is the health and wellness culture at my company strong enough to achieve desired levels of participation without financial incentives or by relying solely on token incentives? If offering no incentives, are we capturing only those who would participate regardless of program design (i.e., already motivated individuals)?
- Is participation in transactional activities an appropriate success measure if individual, optimal state of health and well-being is the goal?
It will be interesting to monitor trends in incentive design as companies strive both to increase participation in health and well-being activities and ensure employees perceive that the company values their health and well-being. As well, as more organizations take a more comprehensive view of well-being and look for appropriate success measures, will participation in traditional wellness activities maintain the same weight. The role of organizational culture must also be considered when determining the most appropriate incentive strategy to advance an organization’s goals for program participation, employee satisfaction, and employee perceptions of organizational support.
References:
- National Business Group on Health. Issue Update: Summary of the Current Use of and Evidence Base for Financial Incentives. https://www.businessgrouphealth.org/pub/?id=f30a5067-2354-d714-5100-e34a0d78c5fc. Accessed Aug 23, 2017.
This commentary is based on data from the HERO Scorecard Benchmark Database through June 30, 2017
Gretchen Heacock, M.Eng is a Wellness Solutions Specialist at Mission Health System in Asheville, NC where she helps manage the employee wellness program of over 12,000 employees and dependents. She received her Bachelor of Biomedical Engineering from Case Western Reserve University and her Master of Engineering from North Carolina State University. Gretchen merges her engineering mindset with a passion for improving patient outcomes to bring innovative solutions that help to increase the health and well-being of Western North Carolina.
Comments are closed.
Great article and spot on!